The Evolving Labor Force in the US; and how to deal with it… Adrian A Davis
A Brief Introduction
As I engage with small and medium sized businesses across the US, I get exposed to lots of different manufacturing, distribution, and service industries. At those businesses, when I ask their biggest issue I hear a familiar refrain: “I cannot staff my shifts,” “I have raised my rate of pay by xx% since the pandemic began, and I still cannot find enough people,” “Do people just not want to work?,” “This younger generation does not want to work,” and many other variations of the same. The staffing situation is terrible, across industries, and I am here to tell you it WILL NOT get better (more available employees) for a very long time.
Facts and Figures
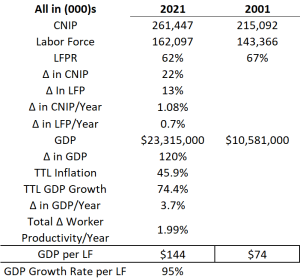
Let us start with the situation as it stood at the end of 2021. The pandemic had waned and most people who wanted to work decided to rejoin the workforce. At that time the US had approximately 261 million people over the age of 16, this makes up the “Civilian Non-Institutional Population (CNIP).” Stated another way “CNIP” are those peoples over 16 and reasonably expected to be employed (IE not in prison or incapacitated). Of that group 162 million identified as either employed or unemployed = Labor Force (LF) (per Bureau of Labor Statistics definitions), a “Labor-Force Participation Rate (LFPR)” of 62%. Looking back to the end of 2001 those numbers were 215 million and 143 million respectively, a LFPR of 66.7%. That represents a 21.5% increase in the CNIP, but only a 12.9% increase in LFPR. Over the 20-year period (2001-2021), that equates to an annual increase in CNIP of 1.07%, and an annual increase in labor force of 0.65%. During that same period output as measured by GDP rose from $10.5T to $23.5T, a growth rate of 3.71% per year (adjusted for annual inflation of 2.13% during the same period). During that same period the average worker’s productivity increased by 1.99% per year on average. To make this a comparable metric it is easiest to show this as expressed as GDP per person in the LF. Over the last 20 years the GDP per person in the labor force has grown by 95%, from $74k to $144k. While this represents significant growth it is not as much as seen in the prior 20 year period.
Workforce Comparison 2001 to 2021
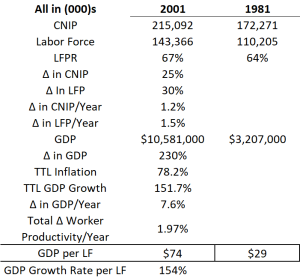
In 1981, the US had a CNIP of 172M and a LF of 110M for a LFPR of 64%; like that of 2021. From 1981 to 2001 the CNIP grew 24.8% (172M to 215M) while the LF grew 30% (110M to 143M)! CNIP on an annual basis grew 1.24% while LF grew 1.5% per annum. As you will note this is the opposite of what was experienced from 2001 to 2021. Before moving on it is important to note that it is possible for CNIP to grow at a slower rate than LF. How? By people (women) entering the workforce who were not part of the participation rate in 1981.
Looking towards economic growth, the GDP in 1981 was $3.2T and by 2001 had grown to $10.5T, a 230% gross growth rate. Correcting for inflation over that period net growth of GDP was 150.8%, or 7.6% per year. During this period worker productivity expanded by 1.97% per annum. So, from 1981 to 2001 the GDP per person in the labor force grew by 154%, from $29k to $74k.
Workforce Comparison 1981 to 2001
What does this data tell us about the workforce? Firstly, the overall growth of the CNIP and of the LF has slowed relative from 2001 to 2021 compared to 1981 to 2001, there are fewer people. Secondly, the economic breakthroughs of the late 90s did not translate into similar growth during the 21st century. In fact, overall growth has slowed.
Conclusion
The bottom line: fewer people are entering the workforce as compared to prior periods and the advancements made by businesses in efficiency and productivity have NOT bridged the gap. The population age demographic changes can be seen in the tables below. As you can see the growth of the working age of people has slowed considerably since the 1981-2001 period.
Working Age People - 1981 to 2021

So, what will happen? Because we will not generate enough replacement employees to fill open roles the cost of labor will continue to increase as GDP growth continues. In fact over the next 20 years, if growth remains at 2001 to 2021 levels output per person in the labor will need to expand to $265K by 2041.
So, what should I do with my business? Invest in maximizing productivity and automation to drive higher output via the employees that are or will be available.
How do I do this? Our advisory service can provide you with access to all the tools and resources you need to maximize productivity and recommend automation opportunities. No matter what is required we have an advisor with the right expertise and experience to drive labor out of your business.
How does this work? We start with a discovery day; this is an eight-hour engagement wherein we learn about your business and discuss your strategy and goals. This discussion is led by our President, Adrian Davis. The discovery day is done for a minimal cost, and we revert with a Pro Forma analysis of how we can drive labor cost out of your business. Just click below to start the journey today!